
13 October 2026
.webp?format=pjpg&auto=webp&width=64&quality=75&branch=main)
Jack McKay
In this article
Jack’s Chart of the Day examines USDCHF’s ascending channel, supportive momentum and US–Swiss interest-rate differences. The analysis outlines potential upside above 0.83800 and the implications of losing support at 0.82684.
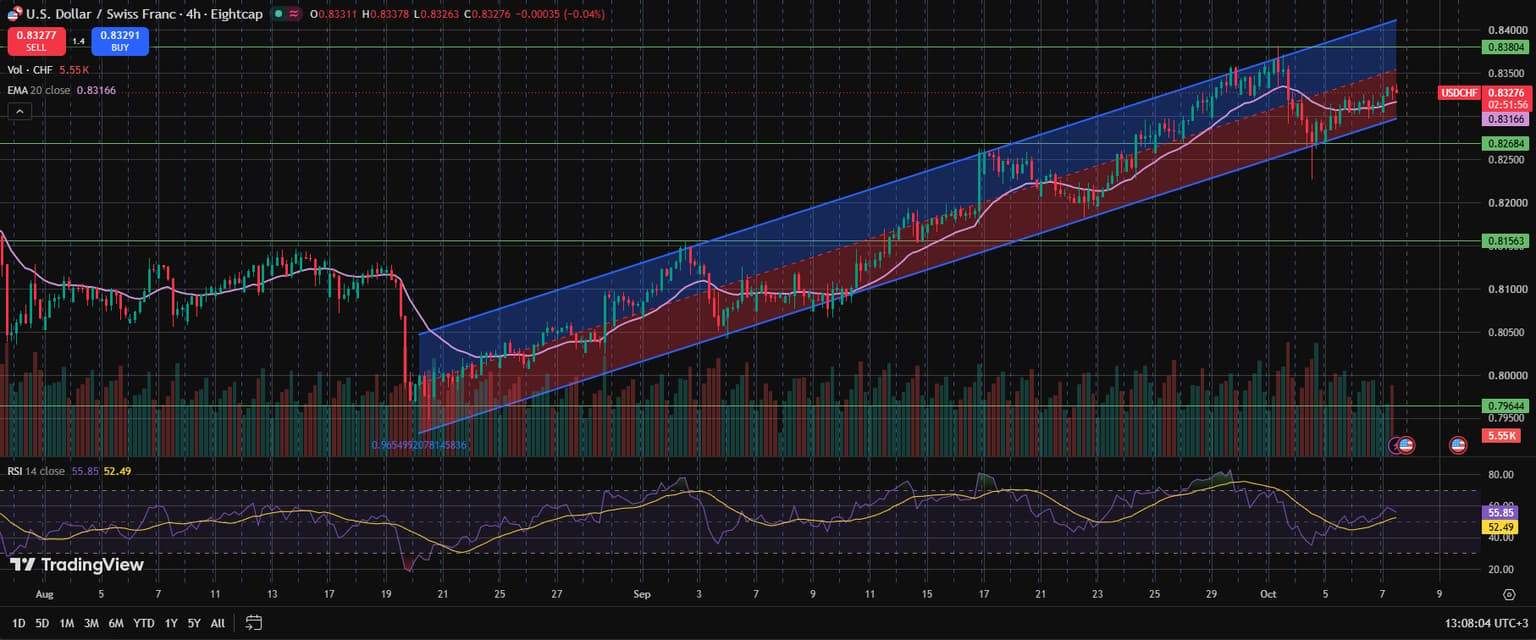
USDCHF, four-hour chart, Eightcap, 6 August to 6 October 2026. Features the 20-period EMA and RSI (14) with its SMA signal line. Chart of the Day edition: 8 October 2026.
Price pattern
The pair has established a sustained ascending channel following a mid-August liquidity sweep to the structural base at 0.79644. Since breaking out of its initial August consolidation range, price action has been characterised by higher highs and higher lows. After peaking near 0.83800 at the turn of the month, USDCHF made a measured pullback to test the channel’s lower boundary near 0.82684. Strong buying demand absorbed the sell-off, driving price back towards the channel’s midpoint, with the pair now trading at 0.83310.
Technical levels
The primary technical anchor is the 20-period EMA at 0.83169, which is sloping upwards and acting as immediate dynamic support. Price is consolidating above key horizontal pivots at 0.82684 and 0.81563. Momentum indicators support the bullish structure: the 14-period RSI sits at 57.51, comfortably above its SMA signal line at 52.61, with room to rise before reaching overbought territory. A confirmed 4-hour close above 0.83800 would signal the next expansion leg towards the upper channel boundary near 0.84200–0.84500.
Fundamentals
Widening US–Swiss interest rate differentials continue to provide structural support for USDCHF, with the federal funds target range of 3.75%–4.00% maintaining a significant yield premium over the Swiss National Bank’s policy rate of 0.00%. The SNB’s sensitivity to real appreciation in the Swiss franc also limits sustained CHF safe-haven rallies during periods of risk aversion. Capital flows heading into Q4 2026 remain positioned towards the US dollar’s yield advantage.
Bottom line
The tactical bias remains bullish as long as price holds above lower channel support at 0.82684. A decisive 4-hour close above resistance at 0.83800 would confirm upside acceleration towards 0.84200 and 0.84500. Conversely, a daily close below 0.82684 would invalidate the channel structure and open the way for a decline towards the horizontal pivot at 0.81563.

.webp?format=pjpg&auto=webp&width=1536&quality=75&branch=main)
Jack McKay | Eightcap Risk Manager
Jack McKay is Eightcap's Simulated Trading Risk Manager.